
The purpose of this guide is to provide an overview of reports in PromisePoint for managers, instructors, and administrators that are accessed in PromisePoint. There are admin reports and department reports. Admin reports are:
How to Access PromisePoint Reports
Click on the menu icon that looks like a graph to access the reports. You must be logged in. PromisePoint users must be included in a report user group to access reports. The user groups for reports are managed by a PASS User Administrator.
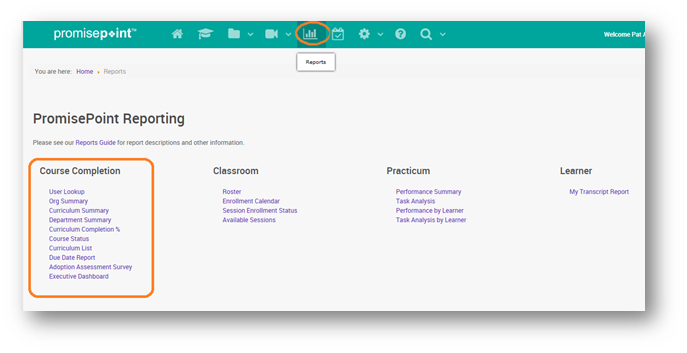
There are 4 types of reports in PromisePoint available, as displayed above; they are:
Course Completion reports display simulation or online course completion data for active users.
Classroom reports display enrollment and attendance information for classroom learning for Instructor Led Training.
Practicum reports display task level tracking information.
Learner report displays a transcript report for the logged in learner.
Course Completion Reports
User Lookup
The User Lookup allows you to search for a specific learner’s profile with a link to their assignment transcript.
How to run it
First, click on User Lookup link.
Second, begin keying in the PromisePoint user name or username to access a directory.
Third, find and select the user.
Fourth, once the selection is made the user profile will display with a choice to either Clear Results or View User Report.
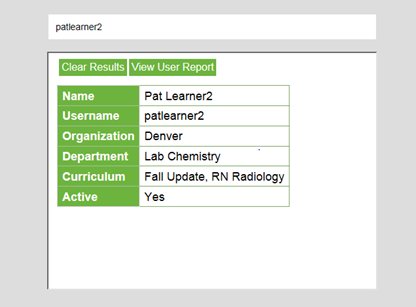
Clearing the results, will remove the profile to begin another search, and viewing user report, will display the leaner’s transcript.
Org Summary and Org Summary by Date
Org Summary
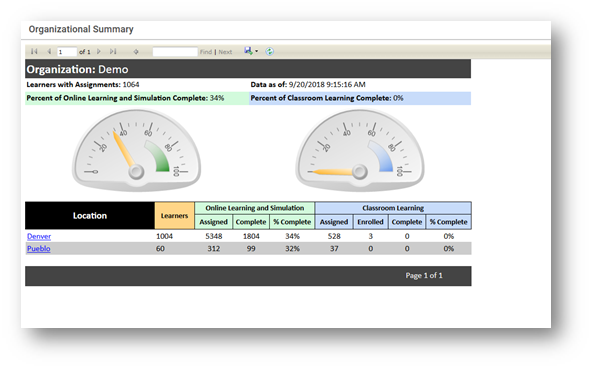
The Org Summary report displays rolled up results of assignment completions for all active learners based on their locations and departments. This report allows you to drill down to department and individual summary information.
How to run it
First, click on the Org Summary link.
Second, the report opens and displays.
The top portion of the Org Summary displays two graphs based on the total learners and their assignments up to the current date. One graph displays the completion percentage for online learning or SIMs and the second graph displays the attendance for the classroom learning.
Org Summary by Date
The Org Summary by Date displays only online learning or SIMs completion data, but can be filtered for a specific time period: Last 7 Days, Last 30 Days, Last 60 Days, Last 90 Days or All Time.
How to run it
First, click on the Org Summary By Date link.
Second, choose your reporting period:
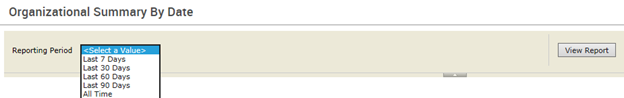
In this example, “Last 60 Days” was selected. The top portion of the Org Summary by Date displays a graph based on the total active learners and assignment completion for the overall organization in the last 60 days, showing that 42% courses were completed in that period.
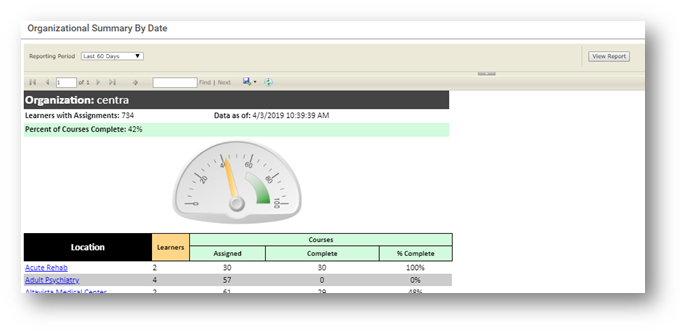
Click the Location links to begin the drill down feature and to view additional detail.
Curriculum Summary
The curriculum summary report displays a curriculum’s progress within a date range by department and can be drilled down to individual learners.
How to run it
First, click on the Curriculum Summary link
Second, the report opens with a data selection header displayed. Begin by selecting the first value in the first field, fields may be based on the previous value: 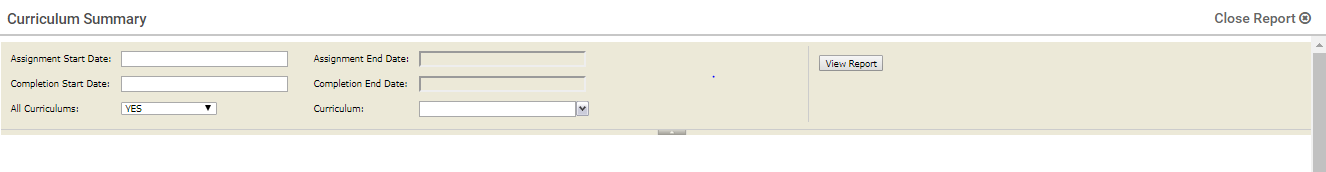
Third, select a range of course assignment dates.
Fourth, select the range of course completion dates.
Fifth, select yes to run the report for all curricula or select no to select specific curriculums.
Sixth, check the boxes of the specific curriculum to run the report if selected no.
Seventh, click, “View Report” once all selections have been made.
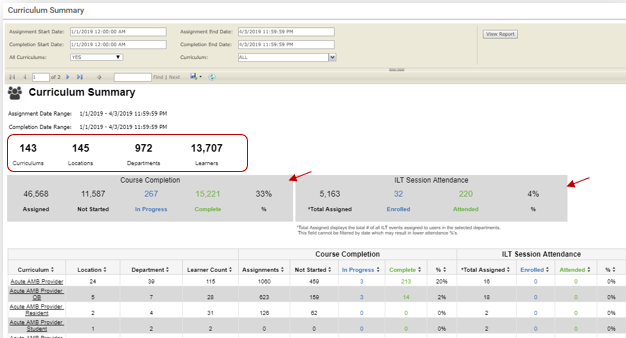
In this example, the report shows all curriculums that have courses and classes assigned from the dates selected.
The top portion of the report displays the overall total amounts of the curriculums assigned to learners with the total locations and their departments. On the second line, the report breaks down online course completion results and ILT Session Attendance.
The lower portion of the report allows you to click the curriculum link to drill down to a department list report based on the curriculum, and from there the department link will drill down to the learners assigned to the curriculum. From the department list drill down to the leaners assigned to the curriculum in the specific department.
Department Summary
The Department Summary report displays learner progress within a date range, based on a department.
How to run it
First, click on the Department Summary link
Second, the report opens with a data selection header displayed. Begin by selecting the first value in the first field, fields may be based on the previous value:
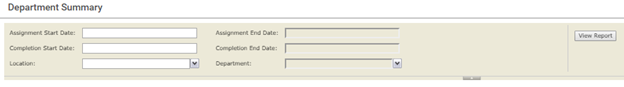
Third, select the range of course assignment dates.
Fourth, Select the range of course completion dates.
Fifth, select yes to run the report for all locations or select no to select specific location.
Sixth, check the boxes of the specific department to run the report if selected no.
Seventh, click, “View Report,” once all selections have been made.
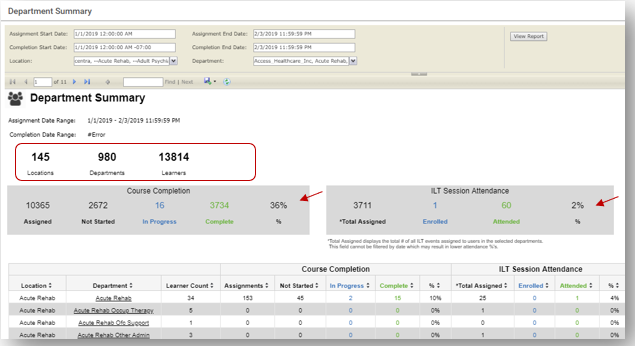
In this example, the report shows all curriculums that have courses and classes assigned from the dates selected.
The top portion of the report displays the overall total amounts of learners with the total locations and their departments. On the second line, the report breaks down the totals between the online course completion results and ILT Session Attendance.
Click the department link to drill down to the leaners assigned to the curriculum in the specific department.
Curriculum Completion%
The Curriculum Completion% report lists learners by departments and their progress toward completing a curriculum within a date range.
How to run it
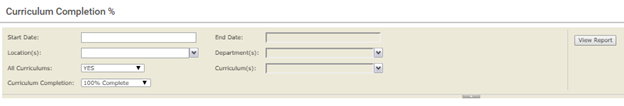
First, select your start and end dates.
Second, select your Location. Here you can choose Select All or check the boxes of the locations you want.
Third, select your departments which will be based on the location/s selected.
Fourth, select Yes all curriculums or no.
Fifth, check the boxes of the curriculums you want if you selected no.
Lastly, click, “View Report,” once all selections have been made.
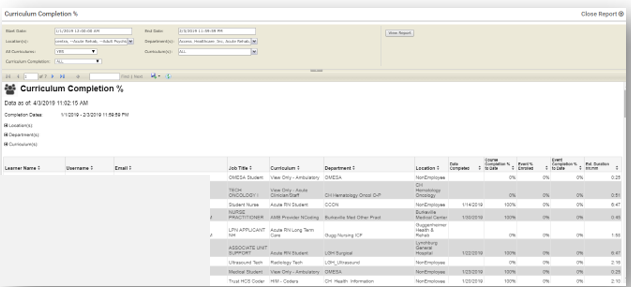
In this example, all locations, departments and curriculums were selected. The report displays with the list of the learners and their learning activity in online/SIMs completions and classroom activity.
Each learner displays a link to drill down to their transcript.
Course Status
The Course Status report displays the status of the course assigned to learners based on location and department.
How to run it
First, click on the Course Status link
Second, the report opens with a data selection header displayed. Begin by selecting the first value in the first field, fields may be based on the previous value:
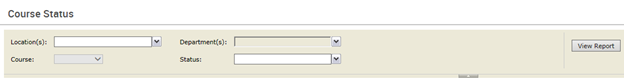
Third, click on the scroll arrow to check the box for each location needed.
Fourth, then, click on the scroll arrow to check the box for each department needed.
Fifth, then, click the scroll arrow to select the course.
Sixth, check the box of each status needed.
Seventh, click, “View Report” once all selections have been made.
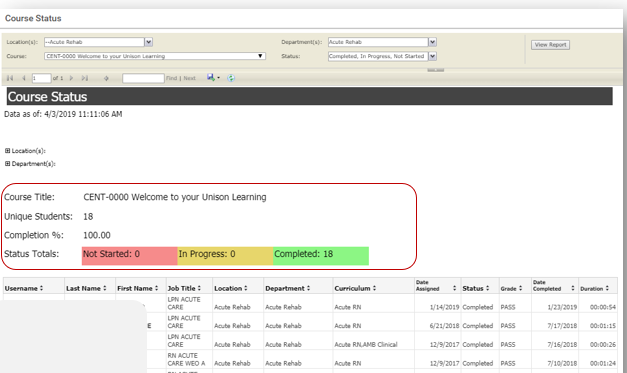
The top portion of the report displays the title of the course, the assigned learners, and the total completion status of learner activity, highlighted in pink, gold and green.
The report lists assigned learners with the course status. It also shows the date and grade if completed and the length of time it took to complete.
Curriculum List
The Curriculum List report displays the courses and events assigned to the curriculum.
How to run it
First, click on the Curriculum List link
Second, the report opens with a data selection header displayed. Begin by selecting the first value in the first field, fields may be based on the previous value:
Third, in the Type field, select the type of learning assigned to a curriculum. This could be events and courses. If selecting Curriculum, the report will list all as the default and will list all curriculums.
Fourth, check the box of the curriculums needed.
Fifth, then, check each box of the event name or the course name, depending on the type chosen.
Sixth, click, “View Report,” once all selections have been made.
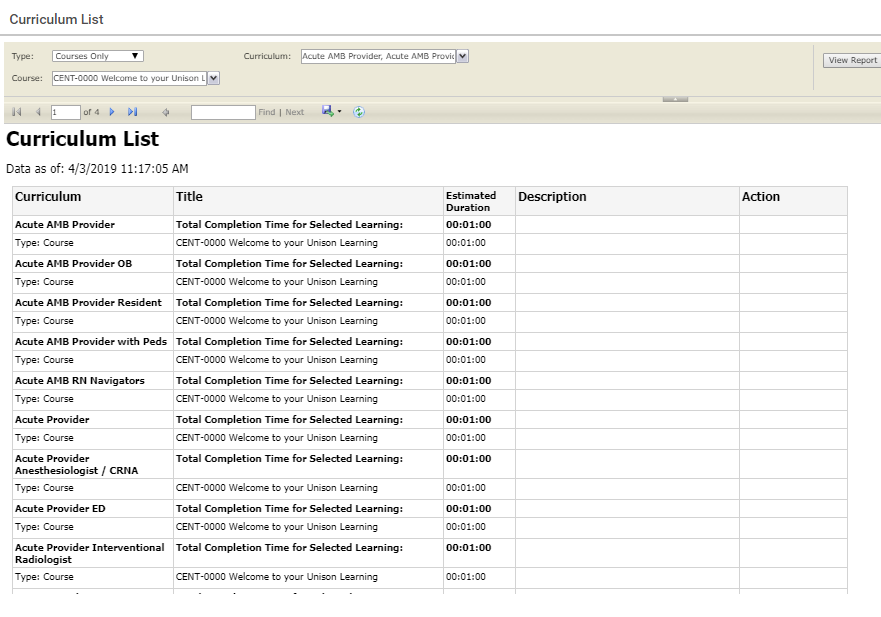
In this example, the selection Type was “Courses Only”, so the report displays the list of courses (sims) assigned to the curriculums selected, with the course details available.
Adoption Assessment Survey
The Adoption Assessment Survey report is based on a survey accessed by the learners once they have taken the course. You can run this report over one, several or all courses.
How to run it
First, click on the Adoption Assessment link.
Second, the report opens with a data selection header displayed. Begin by selecting the first value in the first field, fields may be based on the previous value:
Third, check each box necessary to select the course listed, or select all. Selecting all will cause the report to run longer.
Fourth, use the calendar to pick your date range.
Fifth, click “Run Report:” 
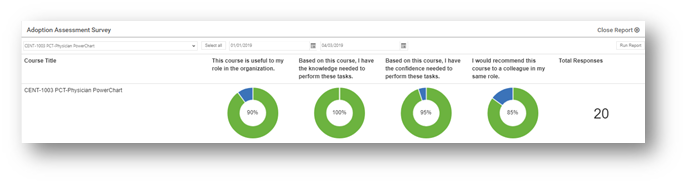
As shown in this example, the courses selected are listed with the questions and how they were answered in a graph that displays the overall response from the leaners who took the survey.
Executive Dashboard
The Executive Department report displays PromisePoint activity within the organization in real-time charts, with the ability to run it over shorter time periods.
How to run it
First, click on the Executive Dashboard link.
Second, the report opens and displays PromisePoint activity in three specific charts: Learner Demographics, Assignments, and Proficiency.
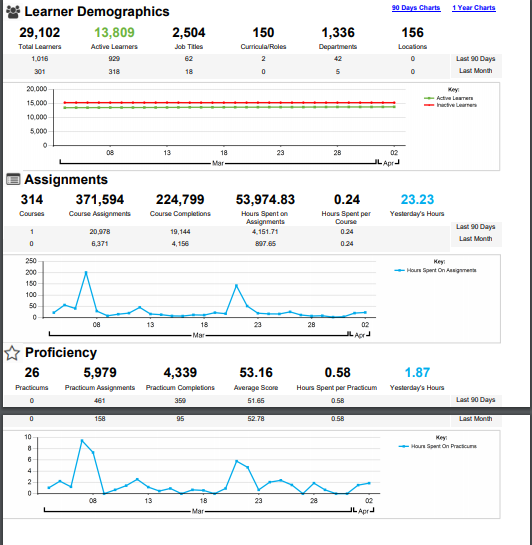
The Learning Demographics chart displays total learners, active learners, job titles, curriculas/roles, departments and locations within PromisePoint and displays a graph to compare active and inactive learners over time.
The Assignments chart displays the total number of courses and course activity that has taken place within PromisePoint and displays a graph with the hours spent on assignments over time.
The Proficiency chart displays the total number of practicums and practicum activity that has taken place within PromisePoint and displays a graph with the hours spent on practicums over time.
 NOTE: There are 4 levels of access for reports, however some organizations may limit the number of levels used.
Admin level - A report admin with admin level has access to all reports at all levels
Executive level - A report admin with executive level has access to Admin Reports at their location level.
Department level - A report admin at department level can only run Department reports at their department level.
Learner level - all PromisePoint learners can view their transcripts.
0 Comments