
Learn how to use the executive summary report as a report administrator.
Short Video: Use the Executive Dashboard
Or follow these quick steps:
- Log into PromisePoint.
- Click the Executive Dashboard link under the Course Completion header.
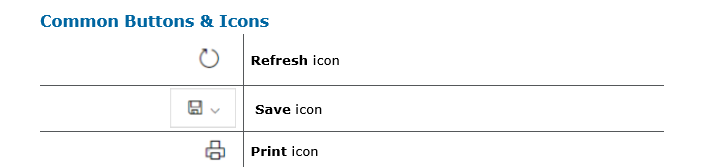
Notes: • Hover over the link to view more information about the Executive Dashboard. • Click the Refresh icon to ensure you are viewing the latest information. • Click the Save drop-down arrow to select a format for your saved report. • Click the Print icon to print any report.
Notes: • The Executive Dashboard defaults to a 30-day time period but the past 90 days also display. • The Learner Demographics section includes all data from the date the organization began using PromisePoint until the present day. • The graph displays after Go-Live. • The Assignments section displays the number of courses, course assignments, course completions, and hours spent on assignments and per course from the time the organization began using PromisePoint, as well as for the past 30 and 90 day periods. • The Assignments graph displays the number of hours spent on assignments in the past 30 days. • The Proficiency section represents the number of hours spent completing practicums over the life of the project as well as for the past 30 and 90 days periods.
- Click Close Report to return to the PromisePoint Reporting Home Screen.
0 Comments